
Master TradingView Charts for Nigerian Traders
📈 Master TradingView charts like a pro! Learn to customise tools, use indicators, set alerts, and analyse Nigerian markets for smarter trading decisions every time.
Edited By
Oliver Hughes
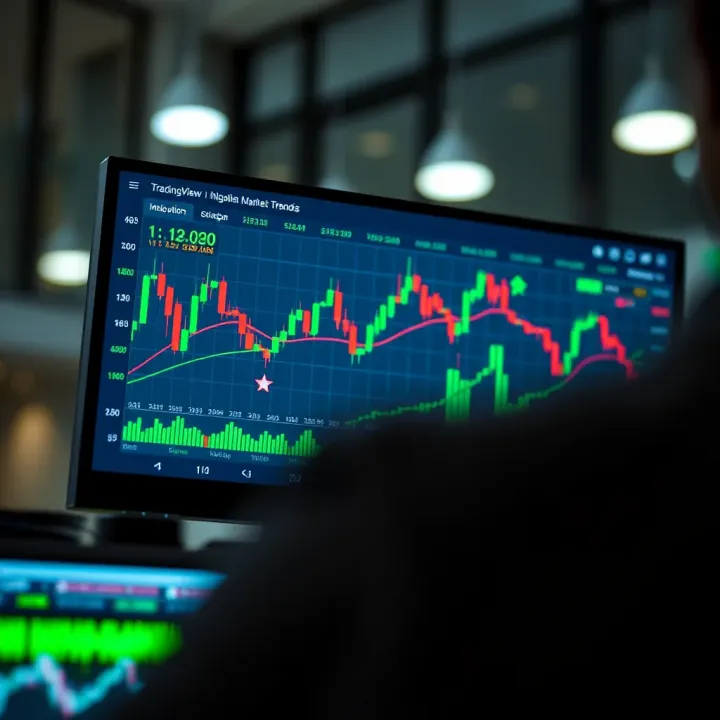
TradingView charts, integrated directly on the Deriv platform, offer Nigerian traders a powerful window into market movements. These charts provide real-time data visualisation essential for making smarter trading decisions, whether you deal in forex, commodities, or synthetic indices.
Nigerian traders face unique challenges like volatile naira exchange rates and intermittent power supply, so accessing reliable and customisable tools is a must. TradingView's charting features on Deriv help address these realities by offering clear visual signals and a variety of technical analysis options.

Using these charts isn’t just for seasoned traders. Even if you're just starting, TradingView on Deriv presents an easy-to-use interface where you can track price trends, spot patterns, and apply indicators tailored to your strategy. From simple moving averages to complex oscillators, these tools let you read the market like a pro.
For Nigerian traders, integrating TradingView charts into your routine can be the difference between reactive trading and making calculated moves based on solid analysis.
You can customise charts by selecting timeframes ranging from 1 minute to monthly views, depending on your trading style. Applying drawing tools to mark support, resistance, or trend lines is straightforward, making it easier to visualise market behaviour.
Here's how these features translate into practical benefits:
Better timing: Spot entry and exit points quickly without guessing.
Risk management: Identify stop-loss levels clearly using chart patterns.
Market insight: Combine indicators like RSI and MACD to confirm signals.
As you proceed, this article will guide you through accessing these charts on Deriv, tailoring the features to your needs, and weaving technical analysis into your trading routine. The goal is to help you turn data into actionable insight, fit for the Nigerian market climate.
With these charts at your fingertips, you equip yourself with a serious edge for trading success.
Accessing TradingView charts on Deriv gives traders a reliable way to analyse market movements with detailed visuals. This integration means you get TradingView’s renowned chart tools directly on a platform tailored for active trading. Nigerian traders can quickly confirm trends, spot entry points, and make faster calls, all without juggling multiple apps. For example, seeing candlestick patterns on Deriv’s charts can help a forex trader anticipate price swings, improving trade timing.
Creating a Deriv account starts with a simple registration where you provide your email, phone number, and set a password. Because Deriv is regulated in various jurisdictions, the registration process includes basic identity verification. This step is essential for security and to gain full access to features like chart tools and trading options. As a Nigerian trader, having your Bank Verification Number (BVN) linked can speed up verification and ensure smoother deposit and withdrawal.
Once your account is ready, locating the trading platform is straightforward. Log into the Deriv website or app, where the dashboard presents different options like Synthetic Indices, Forex, and CFDs. The toolbar often features a clear link to "Charts" or "TradingView Charts". This clear navigation allows traders to jump directly into technical analysis without hassle. For instance, a trader eyeing the NGX 30 index would easily find real-time charts without leaving the platform.
To open the TradingView chart tool, simply click on the chart icon, often labelled alongside the trading assets. Deriv’s platform automatically loads TradingView charts within its interface, offering interactive controls and data layered seamlessly with Deriv’s trading options. This avoids switching windows and keeps focus on market action, reducing delays that might cost valuable trades.
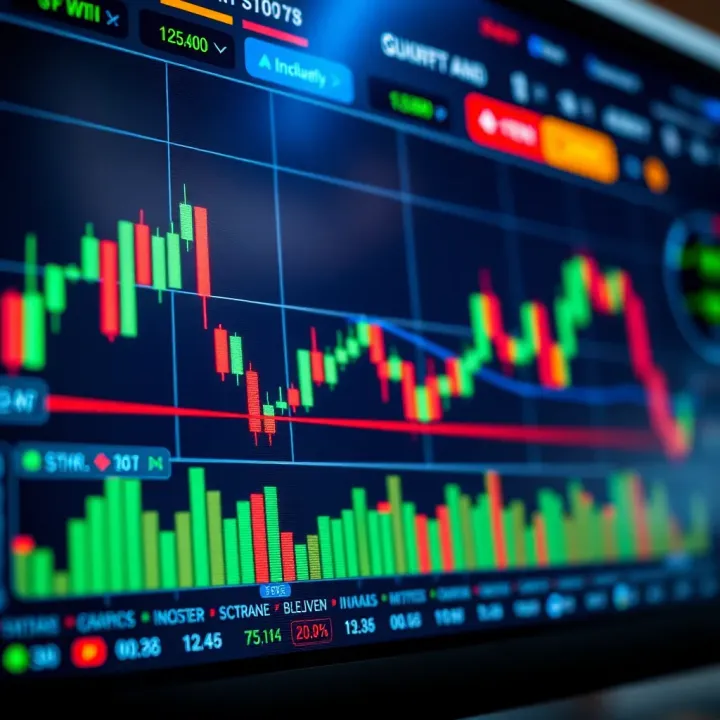
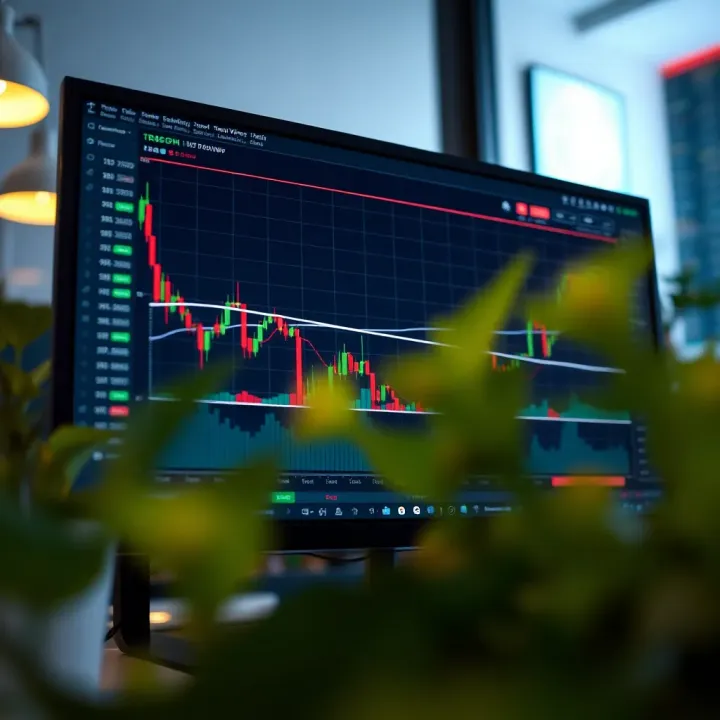
The chart layout and components include the main price chart window, timeline axis, volume bars, and a toolbox with indicators and drawing options. At a glance, you can observe price movements, detect trends, and react accordingly. For example, candlestick colours give a quick sense of bullish or bearish momentum. Besides the price area, panels for order books or recent trades may also display, helping traders confirm signals.
Selecting assets and markets is intuitive on TradingView charts integrated with Deriv. You can pick from forex pairs like USD/NGN or commodities like crude oil, adjusting your focus based on current market interest or news events. This flexibility lets traders tailor charts to their preferred trading instruments quickly, instead of filtering through unrelated options. Nigerian traders can even pinpoint local indices or currencies to stay in tune with domestic market dynamics.
Basic navigation and chart adjustments are done through simple clicks and drag motions. Zoom in on specific periods using mouse scroll or pinch gestures on mobile devices. Switch chart types—candlesticks, line, or bars—with the toolbar to match your trading style. Adjusting timeframes from minutes to daily views quickly changes analysis depth, helping traders decide if a setup suits scalping or longer-term strategies.
Using TradingView charts on Deriv keeps all essential analysis tools within one platform, saving time and improving decision-making for Nigerian traders. Being able to access and customise charts swiftly is a key advantage in today’s fast-moving markets.
By mastering these first steps—setting up, locating, and using basic features—you set a strong foundation for smarter trading strategies on Deriv.
Customising TradingView charts is crucial for Nigerian traders to make accurate and relevant trading decisions. The Nigerian market has unique characteristics, from currency fluctuations to local market indices and commodities, which means a one-size-fits-all approach to charting doesn’t work well here. Tailoring charts to reflect local realities helps traders identify opportunities and risks more effectively.
When it comes to chart types, TradingView offers various options like candlestick, line, and bar charts. Candlestick charts are the most popular among Nigerian traders because they reveal price action with more detail, showing open, close, high, and low prices for a specified period. This makes it easier to spot reversal patterns or trends, for example, when tracking the price of the Nigerian Stock Exchange’s All-Share Index (ASI). Line charts are simpler, connecting closing prices over time, and are useful for a quick overview of price direction without distractions. Bar charts provide a middle ground, showing price ranges like candlesticks but with less visual detail.
Selecting the right timeframe is just as important. Short-term traders, such as those involved in forex or commodities trading on Deriv, often prefer 5-minute to 15-minute charts for quick entry and exit. Conversely, long-term investors focusing on Nigerian equities or indices tend to use daily, weekly, or even monthly charts to understand broader market trends. For example, a trader following the price of Nigerian crude oil (Bonny Light) might use a daily chart to assess supply and demand changes over weeks, while a forex trader might stick to 15-minute charts to capture short bursts of volatility.
Viewing assets quoted in naira (₦) on TradingView charts on Deriv makes analysis more precise for local traders. It reflects the real purchasing power and exchange rate impacts directly in the local currency. This is highly beneficial for retail investors tracking stocks like Dangote Cement or MTN Nigeria, whose values in naira are influenced by currency depreciation and inflation. Seeing prices in naira avoids confusion that might arise from converting USD or GBP prices off-chart.
Integrating local indices and commodities further enriches the trading experience. Besides the ASI, indices like the NSE Consumer Goods or Banking indices provide sector-specific insights. Commodities such as Nigerian crude oil and cocoa can also be charted. This integration helps traders relate global price movements to local market conditions, like how rising crude oil prices might impact Nigeria’s foreign reserves or petrol imports. Such context allows smarter decisions, particularly when using Deriv’s derivatives to speculate on these assets or hedge exposure.
Tailoring TradingView charts with Nigerian currency and market data turns generic charts into powerful tools that speak directly to local market realities, improving trading outcomes.
Technical analysis tools are indispensable for traders aiming to make informed decisions on Deriv using TradingView charts. These tools allow you to interpret market behaviour, identify trends, and anticipate price movements, which are essential for navigating the volatile Nigerian markets. Leveraging such tools directly on Deriv's charting platform helps you combine data-driven insights with your trading options effectively.
Indicators like the Relative Strength Index (RSI), Moving Average Convergence Divergence (MACD), and Bollinger Bands provide snapshots of market momentum, trend strength, and volatility. For instance, RSI highlights overbought or oversold conditions, which could be crucial during periods of naira fluctuation. MACD, through its signal line crossovers, helps confirm trend directions, while Bollinger Bands track price volatility — vital for timing entry and exit points in volatile markets like forex or crypto on Deriv.
Adding indicators on Deriv is straightforward. Within the TradingView chart interface, you can click on the “Indicators” button and search for your preferred tools. Adjusting parameters, such as RSI’s period or Bollinger Band’s standard deviations, allows you to tailor these to specific asset behaviours or your trading timeframe. This customisation is helpful, especially when analysing Nigerian stock indices or currency pairs sensitive to local economic events.
Drawing trendlines and shapes provides a visual framework for market analysis. For example, connecting rising lows in a BTC/USDT chart on Deriv can illustrate an uptrend, helping you decide whether to hold or sell. Lines and geometric shapes like rectangles are also effective in highlighting price channels or consolidation zones, enhancing your ability to spot breakout or reversal points.
Marking key price levels and zones serves as a roadmap for managing trades. Support levels might indicate where the price usually bounces back, while resistance zones show where selling pressure often increases. Say, if the NGX index repeatedly finds support at a specific price, marking this could guide your stop-loss placement or profit targets. This practice sharpens your risk management and fine-tunes your strategy in sync with the price action.
Using technical analysis tools on TradingView charts helps Nigerian traders not just react but anticipate market moves, which is crucial for maintaining an edge in Deriv’s dynamic trading environment.
By combining indicators and drawing tools within TradingView charts on Deriv, you get a comprehensive setup that enhances your market reading skills and sharpens your trading decisions amidst Nigeria’s unique market conditions.
Making informed choices when trading on Deriv hinges on correctly reading charts. TradingView charts offer detailed insight into price action and volume data, two pillars of technical analysis. Understanding these elements empowers Nigerian traders to anticipate market movements instead of merely reacting, which can significantly raise the chances of success.
Interpreting candlestick patterns on TradingView charts is critical. Each candlestick summarises price behaviour for a specific timeframe, showing the open, close, high, and low prices. For example, a bullish engulfing pattern, where a large green candle completely covers a preceding smaller red candle, often signals a potential upward reversal. Nigerian traders can spot such patterns early to enter long positions, especially in volatile forex pairs like USD/NGN or popular commodities. Conversely, a shooting star candlestick near a resistance level might warn of a downward move.
Understanding volume trends adds another layer of confirmation to price moves. Volume reveals the number of trades or contracts exchanged, signalling market interest. Rising price with increasing volume is more trustworthy than price movement with weak volume. So, if gold prices rise on Deriv with strong volume, it suggests genuine buying pressure, making a bullish trade more appealing. Ignoring volume can lead to falling for false breakouts, a common trap even for seasoned traders.
Pairing technical analysis with the right Deriv contract type improves strategy precision. For instance, when a trader notices a strong bullish candlestick pattern supported by increasing volume, they can choose a 'Rise' contract to profit from further price appreciation. If the chart hints at a reversal or consolidation, a 'Range' contract might be safer. This approach matches the transaction type with market behaviour, reducing guesswork. Nigerian traders dealing with naira volatility and broker spreads benefit from such targeted contract selection.
Risk management remains key regardless of chart signals. Deriv provides features like stop-loss settings (available on some account types) and definite expiry times to limit potential losses. Using chart patterns together with strict limits helps avoid betting large sums on uncertain moves. For example, setting a stop-loss just below a recent support level marked on TradingView charts guards against sudden market shocks, like unexpected CBN policy changes. Nigerian traders should also not overleverage, given the challenges of naira fluctuations and import cost pressures that affect markets.
Insight: Combining candlestick patterns and volume trends on TradingView charts with Deriv’s contract choices lets you trade smarter, not harder. This synergy, paired with prudent risk controls, can protect your capital and boost profits.
By mastering these chart reading skills and contract matching techniques, Nigerian traders using Deriv can navigate the markets more confidently and make well-informed trading decisions.
To make the most of TradingView charts on Deriv, troubleshooting and optimising your charting experience is key. A smooth, responsive chart setup helps you analyse market movements sharply and make confident trading decisions. Especially for Nigerian traders who often face challenges like spotty internet or power fluctuations, knowing how to tackle common technical hitches keeps you ahead of the game.
Fixing loading problems: Slow or failed loading of TradingView charts on Deriv can be frustrating, especially when market timing is tight. This often happens due to weak internet connectivity or overloaded browser caches. To fix this, refreshing the page helps in many cases; clearing your browser cache and cookies can also improve loading speeds. Switching to a stable Wi-Fi connection or using a mobile data provider with better coverage in your area can make a big difference, particularly outside big cities where network strength varies.
Occasionally, browser extensions interfere with chart loading, so try disabling ad blockers or script blockers temporarily. If the issue persists, switching browsers between Chrome, Firefox, or Edge often resolves compatibility glitches with TradingView tools on Deriv.
Ensuring chart data accuracy: Accurate data is the backbone of reliable analysis. TradingView sources prices from various exchanges, but sometimes delays or errors creep in, impacting your signals. To stay sure of the data’s correctness, cross-check the asset prices displayed with those from trusted Nigerian trading platforms or forex rates published by the Central Bank of Nigeria (CBN).
Also, watch out for unusual price spikes or missing candlestick bars signaling data delays. Refreshing charts regularly and confirming real-time mode is activated ensures charts update promptly. This is especially vital when trading volatile assets or during major news events in the Nigerian market that affect naira or local indices.
Optimising layout for smaller screens: Using TradingView charts on a smartphone requires adapting the interface to smaller screens. Zooming into key price areas and hiding unnecessary tools declutters the display and makes it easier to read candlestick patterns. Deriv’s mobile version allows toggling between full-screen and compact modes; choosing the compact view saves space and lets you monitor charts alongside trade options.
Also, adjusting chart colours for better contrast under Nigeria’s bright sunlight helps reduce eye strain during long trading sessions. Night mode is handy when trading late into ember months or at odd hours.
Navigating charts smoothly on smartphones: Swiping, pinching, and tapping should feel effortless on mobile to keep up with fast market changes. Always update your Deriv app to the latest version for improved touch responsiveness and faster loading.
Bookmark favourite assets or technical setups to access important charts quickly without scrolling through menus. Lastly, using a reliable smartphone with decent RAM prevents lag, a common issue when juggling multiple trading apps or browsers in Nigeria's network environment.
Staying on top of technical issues and optimising your chart set-up will sharpen your Deriv trading experience, letting you react swiftly to market moves without technology holding you back.
📈 Master TradingView charts like a pro! Learn to customise tools, use indicators, set alerts, and analyse Nigerian markets for smarter trading decisions every time.
📊 Learn how Nigerian traders can effectively combine TradingView’s charts with Deriv’s platform for smarter trading decisions. Step-by-step tools and tips inside!
Discover how TradingView's charts, social network, and mobile tools help Nigerian traders analyse markets and make smarter decisions ₦️📈 Start trading wisely today!
Explore TradingView’s features, charts 📊, and broker integrations for Nigerian traders. Boost your strategies with tools & local market insights!
Based on 8 reviews